Smart investors want to understand (and limit) their “worst-case scenario.” How about a 750% explosion in joblessness from a 3.5% unemployment in Feb 2020 up to a new peak unemployment record of 30% (worse than even the 1933 The Great Depression Peak of 24.9%)? That is precisely the rental property “stress-test” many respected economists and even members of the Federal Reserve continue to forecast. Nobody knows for certain where Unemployment will peak, but what if a 30% unemployment rate is already “baked into the cake” thanks to the COVID-19 Pandemic? As the Portfolio Manager of Damris Capital’s Diversified Mobile Home Park Portfolios, I have overseen our co-investors’ long term holdings grow to almost 10,000 rentable units across 45 properties in 18 different states. In this article, I will share my own research as a concerned residential property investor seeking answers. Bottom line: What happens to a residential investment property if unemployment peaks at 30%? Let’s dive right in.
The Worst-Case Scenario For Multi-Family Investors
As a Multi-family apartment business owner, your worst-case scenario is typically caused by one of these two problems:
- Tenants do not want to buy your product (demand crush)
OR
2. Tenants cannot afford to pay for your product (collection crush)
Both are equally painful scenarios, but very different from each other.
For example, the preferences of residential tenants tend to change gradually, yet what they can or cannot afford tends to change suddenly. Much like the risk associated with a pandemic or a direct hurricane strike, do not confuse the chance of occurrence with the magnitude of an outcome. A broad and sudden rise in unemployment to 30% is a risk every investor should understand, plan for, and hope to never see in their long investing career. As a rule of thumb, remember this statement when planning for “events that may kill you.”
“The absolute worst-case scenario has yet to happen and will likely happen all at once. ”
Calculating Your Break-Even Collection Rate: The Most Important Metric in an Unemployment Crisis
Very early in the crisis, my partner and I were trying to figure out how far collections would have to deteriorate before our properties lost their positive cash flow standing. We hypothesized that if our residents retained the ability to pay, they would likely remain current. This is especially true for most MHPs (Mobile Home Parks) as the residents overwhelmingly lease only the land and own their structures. Therefore, the tenant will avoid putting their most valuable asset at risk. From running the numbers across our parks, the break-even collection rate for a typical property in our portfolio with a 60-70% loan to value ratio was about 55-60%.This becomes closer to 50-55% if all Capital Expenditures (CAPEX) were temporarily suspended. The formula is very simple:
Average Monthly Operating Expenses / (Total Available Units x Average Rent)
For example, if you had a 10 unit building with an average rent of $1000 and a total monthly average operating expenses of $6,000.
$6,0000 / (10 x $1000) = $6,000/$10,000 = 60% Break-Even Collection Rate
It is at this moment that Multi-Family and MHP investors are grateful for the law of large numbers and the tenant diversification embedded within each property (and in our case multiple properties across a national footprint). The above exercise is all but academic for the investor who owns only one or two single-family residences.
The COVID Collection Crisis That Never Happened (So Far)
Like most investors, we tracked the spike in unemployment rates from 3.5% to almost 15% in a few weeks. Naturally, we “battened down the hatches” and waited for the Rent Collection to plummet. But Collection Rates across our portfolios held… and kept on holding, month after month. As a matter of fact, take a look at the following Rent Collection Chart prepared by my colleague, Sam Hales, a seasoned MHP operator, over at the Saratoga Group, a Damris Capital Strategic Partner.
Fig 1: Saratoga Group COVID-19 Collection Rates by month
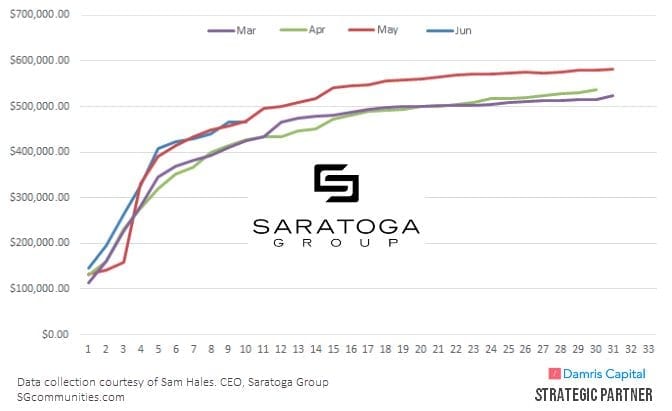
From February 2020 through April/May unemployment rates had risen from 3.5% to about 15%, halfway to 30%, and yet, little to no impact on collection rates to date. This may surprise some, but there are excellent reasons which explain the robustness in Collection Rates. Keep on reading.
What Does a 30% Unemployment Really Mean?
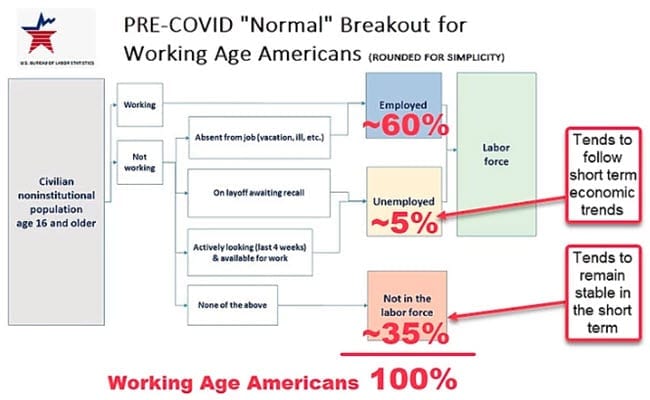
So few of us really know what these “headline statistics” represent. For example, Does a 30% Unemployment rate mean 70% of our tenants are gainfully employed? Logically, we know that couldn’t be true (and it isn’t). According to the US Bureau of Labor and Statistics (US BLS), the unemployment rate is based on the % of Working Age Americans (not the Labor Force). This group constitutes people 16 years of age and older currently residing in 1 of the 50 states or the District of Columbia, not in an institution (e.g., penal and mental facilities, homes for the aged, etc), and who are not on active duty in the Armed Forces. The diagram below from the US BLS is helpful for visually mapping out the complexity built into the definitions. In RED, we added the pre-COVID-19 percentages of working-age Americans in the Employed, Unemployed and Not In The Labor Force segments.
Fig 2: Decoding the Unemployment Rate Definitions
Our research found several takeaways that allowed us to further segment and classify incomes:
- Government Guaranteed – Social Security and Disability Beneficiaries
- Highly Durable – Employed by Public Sector
- Moderate Risk – Employed By Private Sector
- High Risk – Self Employed
- Nothing To Lose – they were already unemployed or not participating (Untapped Potential)
While you can read our full analysis at our blog, here were the key takeaways:
- Employment and receiving income are not the same.
- ~25% of the working-age population receives income from Social Security and/or Disability.
- The government employs about 15% of the entire working-age population. Looked at slightly differently, of those with a job, 25% are employed by the government.
- A 30% unemployment rate will likely hurt private-sector employees and self-employed individuals more than public or military employees (as has been the case historically).
- Assuming the public sector and military jobs remain strong, almost half of all private sector and self-employed individuals would become unemployed in a 30% unemployment scenario.
- ~18% of the working age population had no pre-COVID-19 earnings (students, unpaid house workers, previously unemployed)
Most relevant to our analysis, assuming public-sector and military employment remains unchanged, ~50% private sector joblessness would be required to reach a 30% aggregate unemployment rate. Even in such an extreme situation, ~60% of all working age Americans would still retain income.
Fig 3: Income vs. Employment
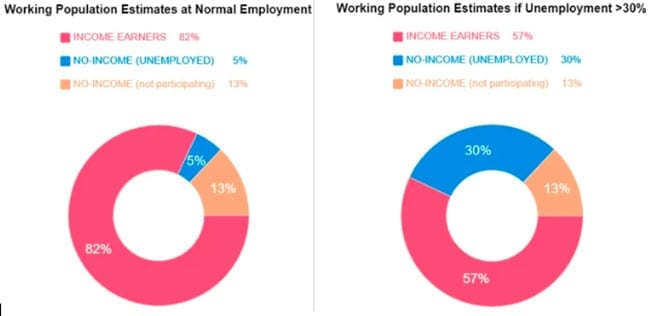
The math suggests a 30% unemployment rate actually means ~60% of Americans are earning income instead of ~80% (when the nation is fully employed).
Because of this, we believe the 60% level represents a sound fundamental floor in Collection Rates for a portfolio of diversified residential tenants. The Powerful Impact of Government Stimulus and Unemployment Benefits On Collection Rates Defying common sense, you may have noticed that May collections (at 14.7% unemployment) are stronger than March collections (at 4.4% Unemployment). This is NOT an isolated incident unique to our portfolios. We forecasted early on that Social Safety Nets would drive this phenomenon that both we and our Multi-Family peers are experiencing. We turned to research again, collecting data for each state where Damris Capital has manufactured housing communities to stress-test a hypothetical tenant's income situation when unemployed.
Fig 4: Damris Capital Calculates The Margin Of Safety From UEB and Stimulus Checks
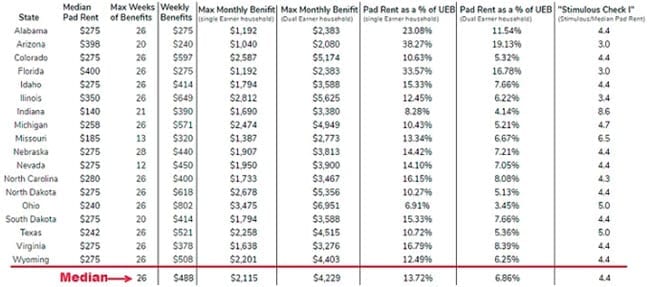
Again, you can check out the original research for more details. The key takeaways are as follows:
- The Median duration of Unemployment benefits (UEB) across our portfolio was 26 weeks (or 6 months).
- The Median Max Monthly UEB is $2,115 per unemployed person, If there are two unemployed persons it rises to $4,229.
- In our Portfolio, that means that Monthly Rent is only 6-14% of a 1 or 2 person UEB check (leaving almost 90% of their paycheck for other expenses… while unemployed)
- Moreover, the CARES ACT provided up to an additional $600 per week (roughly 2,500-5000 more per month for a single or dual unemployed household)
- In addition, the one time $1,200+ stimulus per person equates to about 4.4 months of pad (see Fig 4) rent for a tenant.
“The simple fact is UEB and Stimulus provide a bigger safety net to low-income renters than higher income renters.”
While the $1,200 stimulus check (per tax filer), represents a median of 4.4 months of pad rent in our example, it might represent only 4.4 days in a NYC condo.
Tenant Income: The Hidden Revenue Engine In Your Property
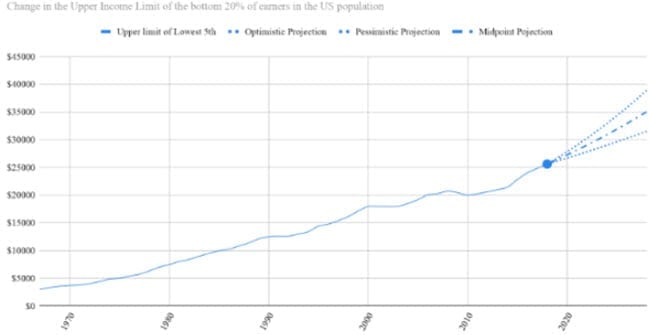
Regardless of how brilliantly an acquisition is made or how efficiently an asset is managed, the most important driver of real estate returns overtime is your tenant’s ability to increase their income. You simply cannot sustainably drive top-line rent growth beyond one-third to one-half a residential tenant’s Gross Household Income (similar metrics exist for commercial tenants too). Sure you can reposition your property to target a more affluent tenant. However, even then, those rents are now tethered to the financial destiny of that class of renters. Just as Warren Buffet is ultimately making a bet on the American economy, landlords are ultimately betting on their residents’ ability to sustain and grow their earnings. Damris Capital tracks the wage growth trends of a typical resident in our properties to forecast ethical and sustainable rent increases. Specifically, we track Census Bureau data on the cohort of Americans that are just above the bottom 20% in household income since we provide Affordable Housing Options to low income residents via the Mobile Home Park niche (should be Fig 5).
Fig 5: Damris Capital Low Income Wage Index (1967 – Present)
Unemployment Peaks Are Temporary, While Wage Inflation Has Staying Power
Every unemployment peak since 1969 has led to temporary and shallow intermissions in the greater wage inflation trend.
Fig 6: Unemployment Peaks Only Slow Long Term Income Growth
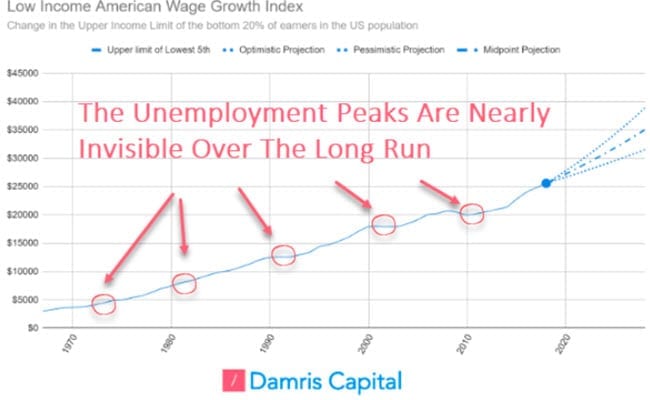
Over the previous 50+ years, the wages of the lowest income Americans have grown annually at 4.25% compounded (Census Bureau). Regardless of your tenant, the chart’s shape will look very similar. The only difference we have seen is the slope. For example, the top 20% of American’s have grown their incomes by about 1 percentage point faster per year than the bottom 20%. It turns out that inflation Is an incredibly powerful and persistent income tailwind (at all wage levels). Even with the massive swings in interest rates, our research shows that wage inflation rates explain 60-80% of residential investment appreciation returns.This number is even higher if examining only rental prices vs. nominal wages.
Figure 7: 100 Years of Home Price Returns Before and After Inflation

Unemployment Peaks >8% have been excellent entry points to gain exposure to residential tenants. Historically tenant incomes and as such real estate prices have appreciated more slowly during episodes of rising unemployment; however, these are often short and followed by extended periods of above-average tenant income growth and above-average rent increases as rents catch back up to incomes. Landlords are typically fast to freeze rents and slow to resume increases during and immediately after high unemployment or recessionary periods.
Conclusion
As investors, we may rent apartment units, but from our tenant’s perspective, this is their home. If their ability to pay suddenly changes (as historically happens), we should approach this with compassion and understanding. That means figuring out where you stand and how much you can afford to help:
- Calculating your property’s Break-Even Collection Rate
- Forecasting your tenants’ ability to pay should a worst-case scenario of 30% unemployment unfolds (being mindful that Income and Employment are not the same things)
- Lastly, you need to understand whether or not your Collections rate will be above the break-even level if/when that worst-case scenario arrives (like a COVID-19 induced 30% unemployment rate).
In addition, don’t underestimate the added margin of safety your tenants will have from UEB and the various rounds of government stimulus (particularly for lower-income tenants who benefited from these programs disproportionately, as well as their landlords– and as such so did their landlords). If your breakeven Collection rate will be tested, it might be smart to retain profits, pause CAPEX spending, and raise your capital reserves. Though real estate investors likely still have additional COVID-19 challenges in the short run, and our long term outlook on Residential Real Estate is Bullish (particularly Affordable Housing). Fully Invested,  P.S. While the original research was conducted on Mobile Home Parks, the takeaways and findings are transferable applicable to our colleagues in the multi-family investing space (particularly the Affordable Housing segments).
About Damian Bergamaschi
 Damian Bergamaschi is an Investor and Co-Founder at Damris Capital, where he leads the research and optimization of Damris Capital’s proprietary Investment Models and Algo-Portfolios. Damian is also the acting Portfolio Manager of The Damris Freedom Funds, which invest in tax-efficient cash flowing Mobile Home Parks across the country. When Damian isn't researching ways to optimize investing systems or his personal finances, you can find him training in his garage gym or building something from scratch around the house with his son. Damian also enjoys sharing his passion with other investors, particularly those new to the craft (young or old). He is on a mission to help investors discover and achieve their Freedom Number sooner- the point at which investments begin to create life-changing options for families.